Design Challenge
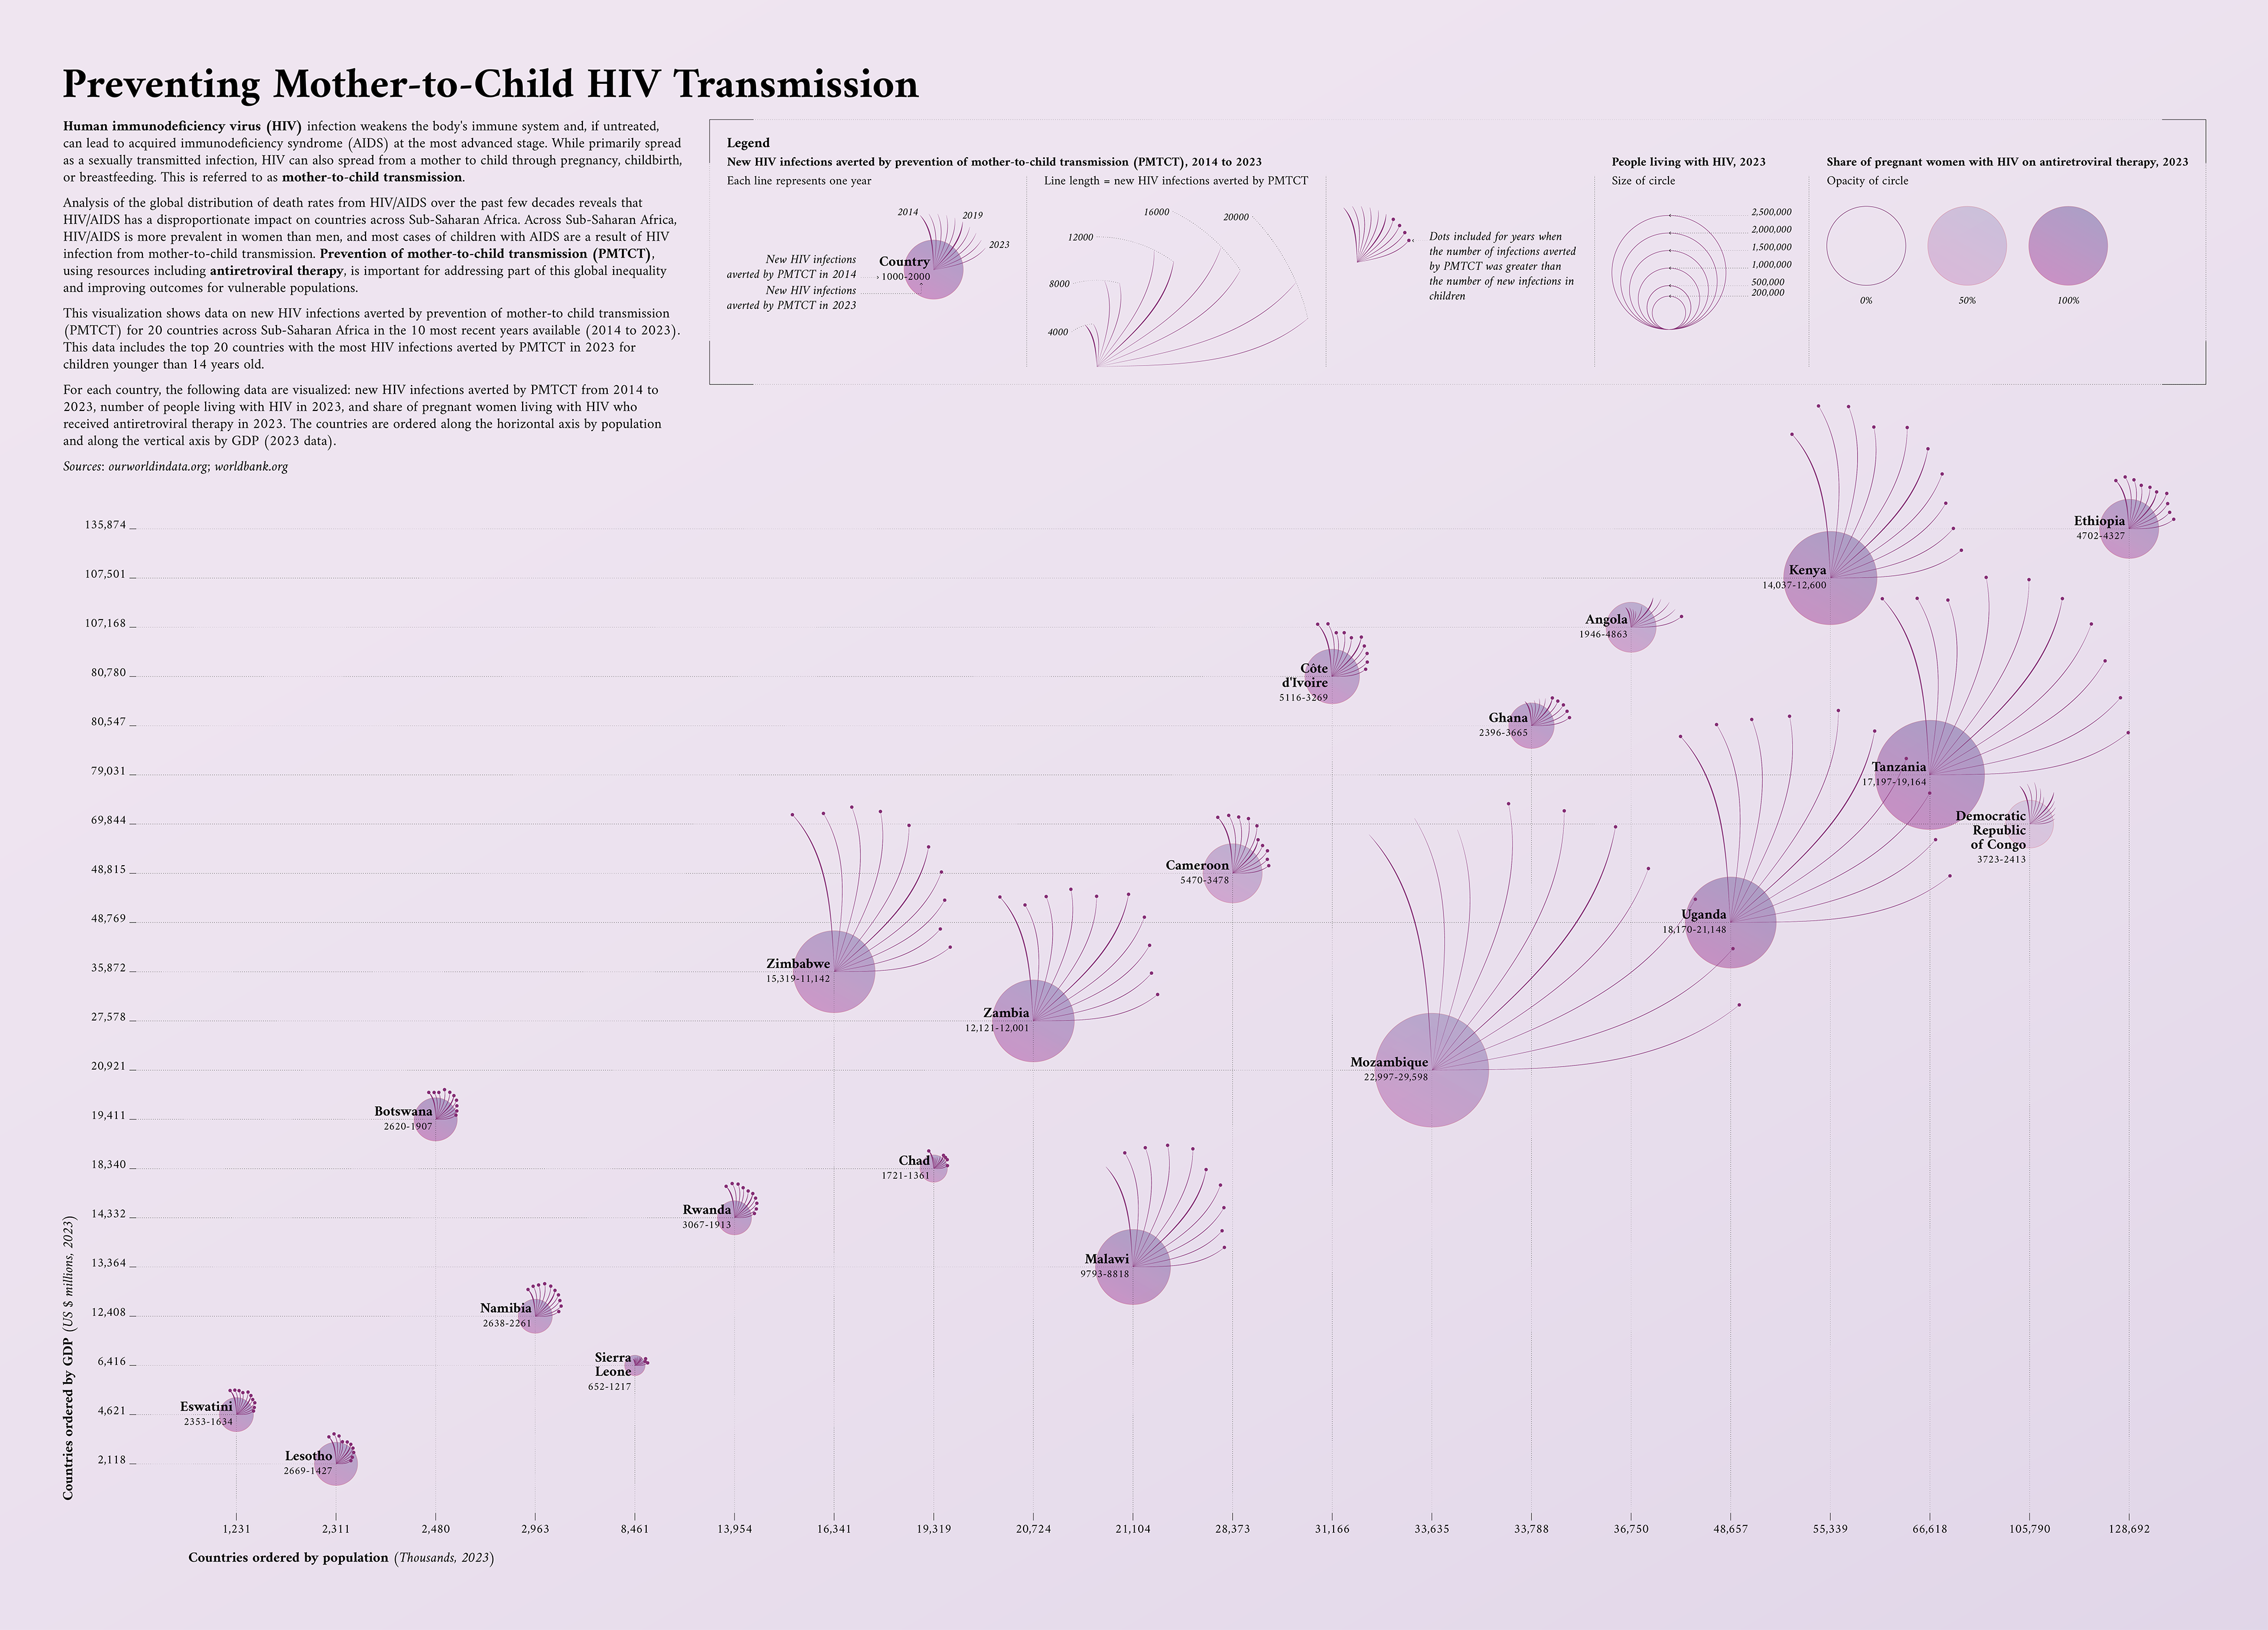
Visualize multiple datasets of information about the prevention of mother-to-child HIV transmission for readers to explore the differences and similarities between countries.
Solution
This data visualization makes use of strong visual hierarchy with a combination of bubble charts, line graphs, and small multiples, allowing the reader to easily compare multiple levels of information at once.
Audience
General
Software
Miro, Google Sheets, Rawgraphs, Adobe Illustrator
Research & Storytelling
I was initially curious about the topic of populations who are not commonly thought of when discussing HIV/AIDS: women and children. The topic of mother-to-child HIV transmission was particularly interesting to me because my highschool biology class had a guest speaker share her experiences with HIV and motherhood.
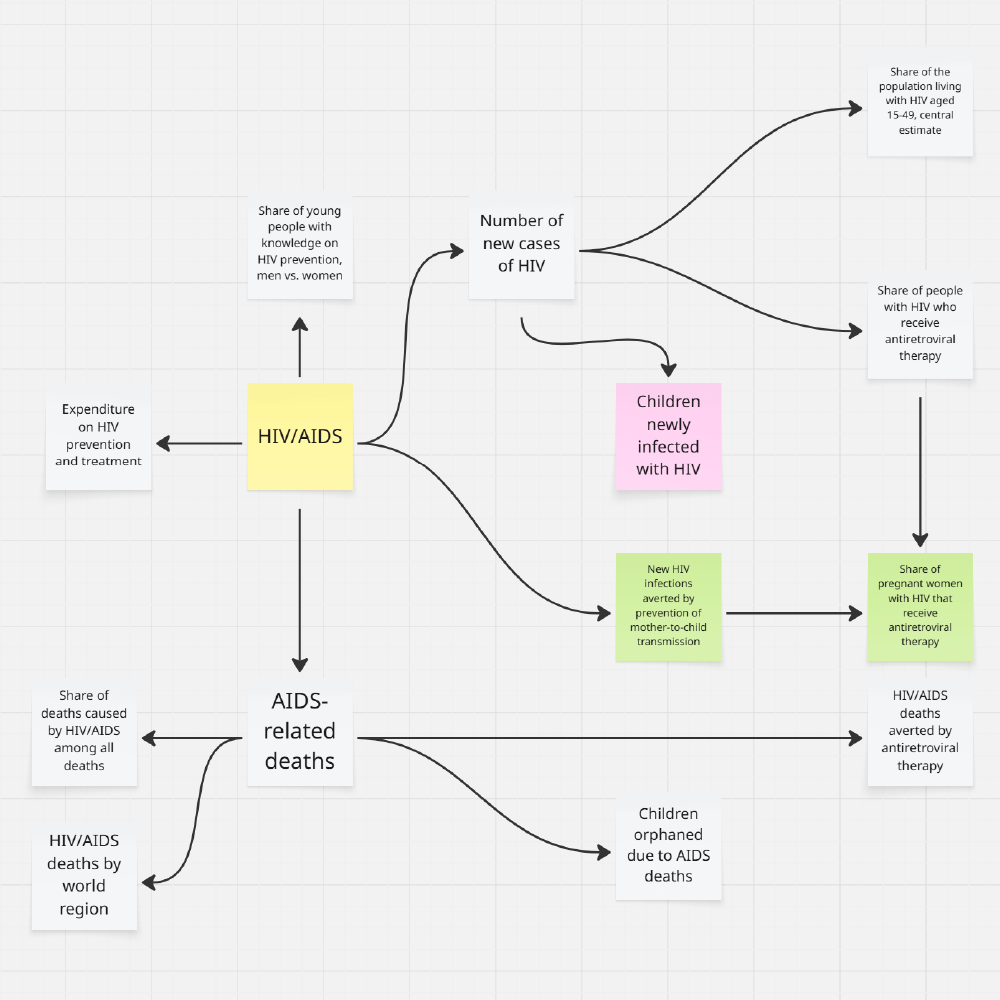
In reality, HIV/AIDS affects diverse populations, and these diverse populations are misunderstood and misinformed. With these main concepts in mind, I explored available datasets and used Miro to visually organize and link ideas together.
Data Cleaning & Asset Development
I imported multiple datasets into Google Sheets for cleaning and organization.
I then used Rawgraphs and Adobe Illustrator to develop and refine the graphs and graphical elements.
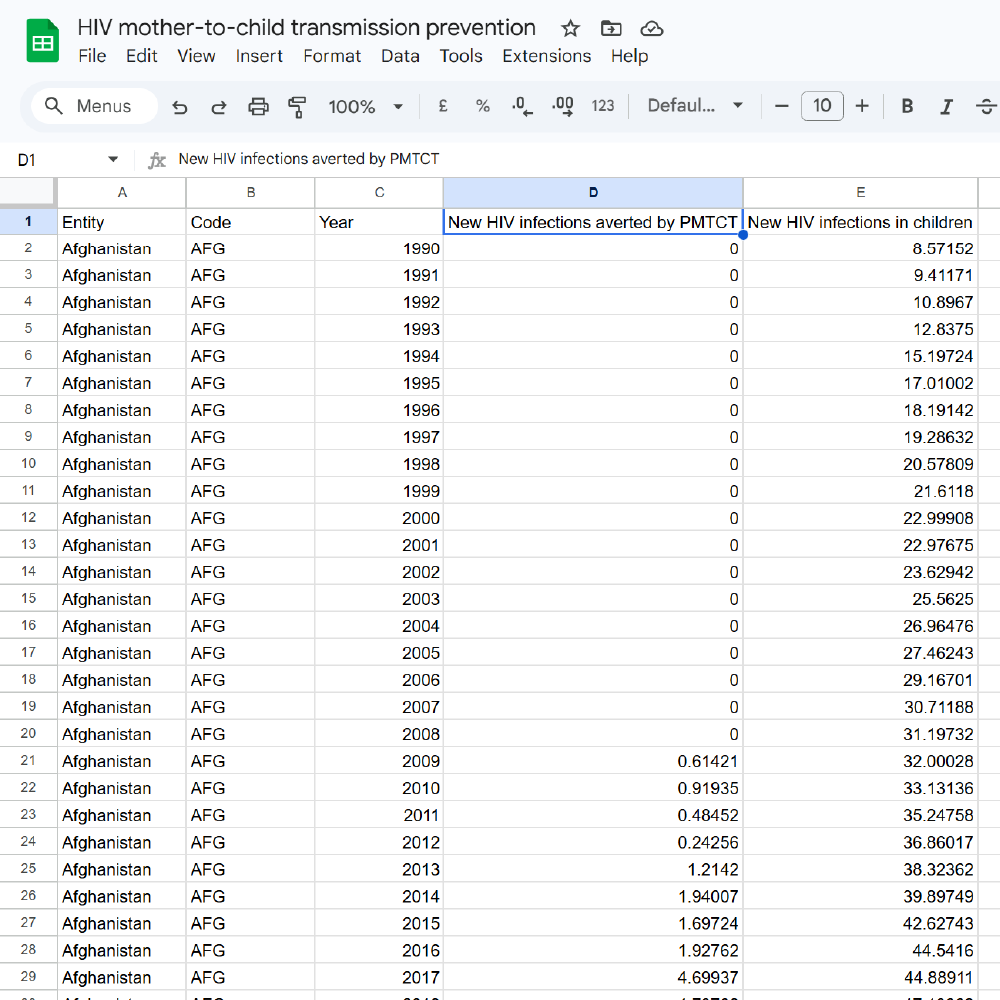
Google Sheets data cleaning

Design ideation
Asset development progress